
Trelitha R. Bryant
VP, Field Testing & Research
Behavioral Sciences Research Press Inc.

Executive Summary
This research report contains a series of studies that examine the social contact inhibitions among salespeople, known as sales call reluctance. Behaviors associated with sales call reluctance (or sales contact reluctance) are measured by the Sales Preference Questionnaire/Full Spectrum Advocacy (SPQ/FSA) assessment. This report primarily consists of data from salespeople in Sweden, Finland and Spain. Some studies also include a sample of salespeople in the US, for comparative analyses. A brief outline and overview of the results is summarized below.
1. Pre- and Post COVID Research
- Due to the pattern of differences found, subsequent studies were conducted using post pandemic data only.
- The report begins with analyzing call reluctance profiles scores pre- and post COVID. The results indicate a pattern of slightly increased call reluctance profile scores for Sweden after COVID. In Finland, there was a slight decrease in profile scores after COVID.
2. Normative Profile Analyses
- Research on SPQ/FSA scales were examined for Sweden, Finland and Spain. Salespeople in Sweden generally had lower levels of call reluctance. The most prevalent forms of call reluctance were studied. The Yielder scale was the most prevalent form of call reluctance across countries.
3. Gender Comparison Research
- Studies indicated that men tend to have lower levels of call reluctance in comparison to women. Results further indicated that these differences were generally minor with little practical meaning, based upon small effect size indices.
4. Research on Motivation and Goal Level
- Salespeople in the US tend to have higher levels of motivation and goal focus in comparison to other countries.
- Salespeople across all countries who have no concerns related to selling and others who have concerns about increasing their income, have significantly higher levels of motivation and goal focus as compared to salespeople who are concerned about other factors.
- Salespeople across all countries who are most competent at generating new business have higher profile scores on motivation and goal level. They also have more optimal scores on every call reluctance scale.
Pre- and Post COVID Research
Generating new business requires salespeople to seek or prospect for new customers. In an effort to help qualify prospective new customers, AI-powered technologies are being utilized to identify customers who may be interested in making a purchase. Although gathering customer profile information can be helpful, a key challenge for many salespeople is utilizing this information to actually contact prospective customers and pursue business development opportunities. The discomfort that salespeople feel when initiating customer contact to promote their products/services is known as sales call reluctance. This condition limits customer engagement activities and thus the ability to develop new business that serves the needs of customers.
Research was conducted to examine if call reluctance behaviors have changed as a result of the COVID pandemic and its impact in the sales marketplace for salespeople in Sweden and Finland. This research utilized data from the Sales Preference Questionnaire/Full Spectrum Advocacy (SPQ/FSA) assessment. This specialized diagnostic tool was developed from a tradition of programmatic research on call reluctance that began over 45 years ago. The SPQ/FSA measures sixteen behavioral forms of call reluctance, a comprehensive Brake scale that is derived from the sixteen types, and other key supplementary scales.
A descriptive profile of results obtained for Sweden pre- and post-COVID is shown in Figure 1A, which summarizes the profile scores for the call reluctance scales. The results indicate that differences associated with COVID are only minor (η2<=.02). Although the differences are small, there is a pattern of slightly higher scores across call reluctance scales after COVID. There are two exceptions to this pattern. Salespeople in Sweden scored an average of 5 points lower on the Online Prospecting Discomfort scale and 1 point lower on the Oppositional Reflex scale. The results for the online prospecting scale in particular, may suggest that salespeople are now more comfortable engaging in virtual selling post-COVID.

The differences between the other SPQ/FSA scales only represent small deviations (η2<=.004). There are no patterns associated with these scales that potentially relate to the pandemic (Figure 1B).

Similar research conducted for Finland also suggests there are minor differences in profile scores for the call reluctance scales pre- and post-COVID (η2<=.03). However, there is a general pattern of lower call reluctance scores after COVID, as shown in Figure 2A. Profile scores for Oppositional Reflex and Famsheild remained the same. This result may suggest that in Finland, these two call reluctance types are more robust.

Results for the other SPQ/FSA scales suggest very minor differences in score profiles associated with COIVD (η2<=.02). These differences do not reflect any particular patterns or trends. However, the results do indicate an average increase in Motivation scores (by 4 points) and Goal Level scores (by 6 points), which collectively may have some practical importance for increased sales activity.


Based on the pattern of differences found in call reluctance profile scores for both Sweden and Finland, subsequent analyses will be based upon data obtained after the COVID pandemic.
Normative Profile Analyses
Comparison of Call Reluctance Profiles
Research has indicated that call reluctance is prevalent across countries. However, call reluctance profiles may differ by country. The following study examines call reluctance profiles for Sweden, Finland and Spain.
Results indicate that there were only small differences in call reluctance profile scores between countries (ω2<=.06). Although these differences represent small effects, there is a general pattern of slightly lower call reluctance profile scores for Sweden in comparison to the other countries with a few exceptions, as shown in Figure 3. On the Hyper-Pro, Role Rejection and Telephobia scales, Swedish salespeople tend to average approximately 4 points or higher in comparison to Finland and Spain. Overall, the slightly lower profile scores for Sweden may be related in part to several decades of education and training support for call reluctance within Sweden’s sales industry.

Prevalent Forms of Call Reluctance
Previous research has shown that salespeople tend to have an average of approximately 5 forms of call reluctance. Therefore, an analysis was run to compare the 5 most prevalent forms of call reluctance by country. The results indicate that Yielder is the most frequently occurring form of call reluctance for each country, as shown in Figure 4. This result is consistent with previous studies conducted for over three decades.
Additional results indicate that the family (Famshield) and friends (Friendshield) scales are the second and third most common forms of call reluctance for Finland and Spain. By comparison, in Sweden, Referral Aversion is the second most common form of call reluctance, followed by the family and friends scales. The results for the top 3 most prevalent forms of call reluctance are fairly similar across countries. These results suggest that a typical call reluctance profile is represented by the tendency to lack assertiveness, especially when communicating with family and friends for the purpose of networking or engaging in sales related activities like asking for referrals.
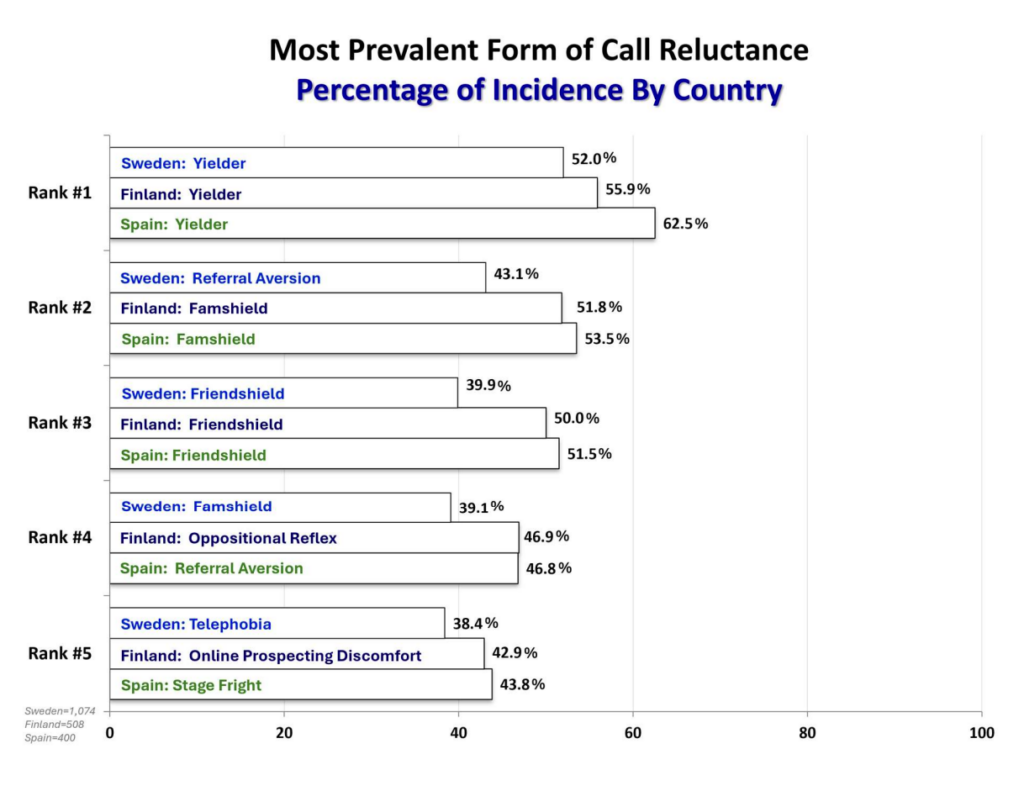
There is less similarity between countries in regard to the fourth and fifth most common forms of call reluctance. These rankings may be more subject to change with time in comparison to the top 3 prevalent rankings.
Overall, research on the most prevalent forms of call reluctance, indicate that Sweden has a lower percentage of incidence per scale in comparison to the other countries. Results further show that Spain tends to have the highest incidence of call reluctance across each of the 5 rankings. As call reluctance training and support expands in Spain, these percentages may be reduced over time.
Comparison of Impostor and Filter Profiles
Further analyses examined the Impostor and Filter profile scores by country. The results indicate only small differences between countries and no observed trends or patterns (ω2<=.06). The countries were particularly similar on the Motivation and Goal Level scales, as shown in Figure 5. The profile scores ranged from 54 to 55 for Motivation. In a similar manner, the scores ranged from 54 to 56 for Goal Level. This average range of scores falls just within the moderate score range, and thus can be interpreted as moderate-to-low profile scores. Further discussion on the topic of Motivation and Goal Level is provided in a later section.
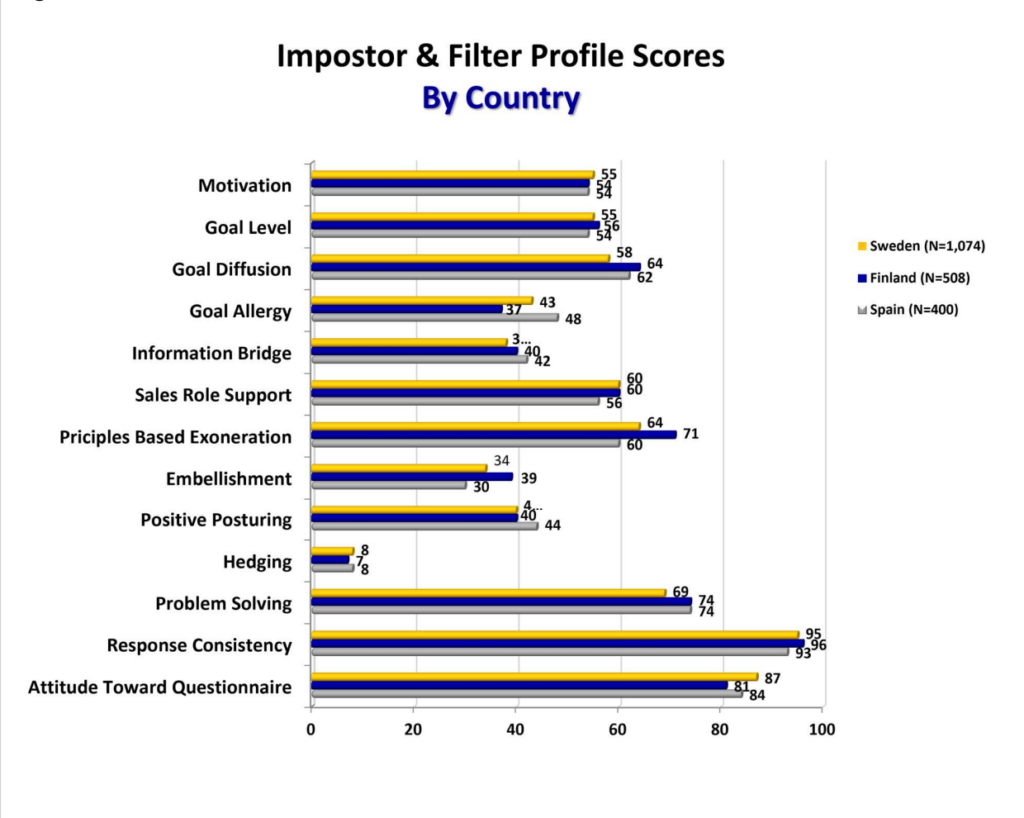
Results for the other Impostor scales indicates more variation in scores, however these differences are associated with small practical effects. In particular, there is a 9-point difference for the Goal Allergic scale, where Finland averages the lowest score. This result suggests that Finnish salespeople may be slightly more comfortable with their sales results being publicly displayed and compared to the work results of others. Yet, salespeople from Sweden and Spain also score in the moderate range on this scale.
The results further indicate an 11-point difference on the Principles Based Exoneration (PBE) scale, where Finland averages the highest score. This result suggests that Finnish salespeople may be slightly more inclined to alter or limit their sales activities if they have concerns associated with organizational practices, work requirements or other job-related factors. If a salesperson has a high level of call reluctance, as measured by the comprehensive Brake scale, any work-related concerns may also function as an excuse to avoid sales activity.
In a previous analysis (see Figure 3), Finland also averaged the highest score on Oppositionality, indicating a slightly higher tendency to engage in noncompliant sales behaviors as compared to the other countries. Thus, a supplemental analysis was done to examine, if there is a correlation between the Oppositional Reflex and PBE scales for Finland.
The results for Finland indicate there is a statistical correlation between Oppositional and PBE (r=.118, p <.05), however the magnitude of that relationship is relatively small (based on the Pearson correlation coefficient), (Cohen, 1988). Similar results were obtained for Sweden (r=.114, p <.05) and Spain (r=.217, p <.05), indicating a relatively small effect size association between scales, as a general rule of thumb (Cohen, 1988). These results suggest that individuals scoring high on the PBE scale may limit their sales activities due to genuinely held concerns, that are not substantially influenced by any Oppositional tendencies. This interpretation concerning the PBE scale applies to those with low levels of call reluctance, as previously discussed. Otherwise, high PBE scores may function as a form of excuse to avoid sales activities, with added support from Oppositional tendencies.
Gender Comparison Research
Gender Comparison Studies: Call Reluctance
Research in a previous section examined call reluctance profiles by country. The following series of analyses examines whether there are any differences by gender within countries. This study compares gender profiles for the U.S. (Men=9,454; Women=4,454), Sweden (Men=696; Women=330), Finland (Men=315; Women=160), and Spain (Men=263; Women=114).
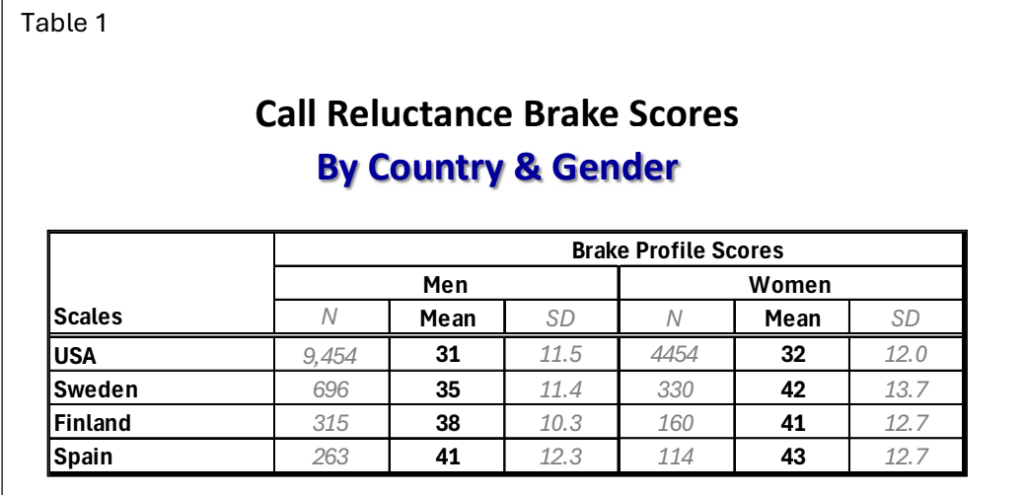
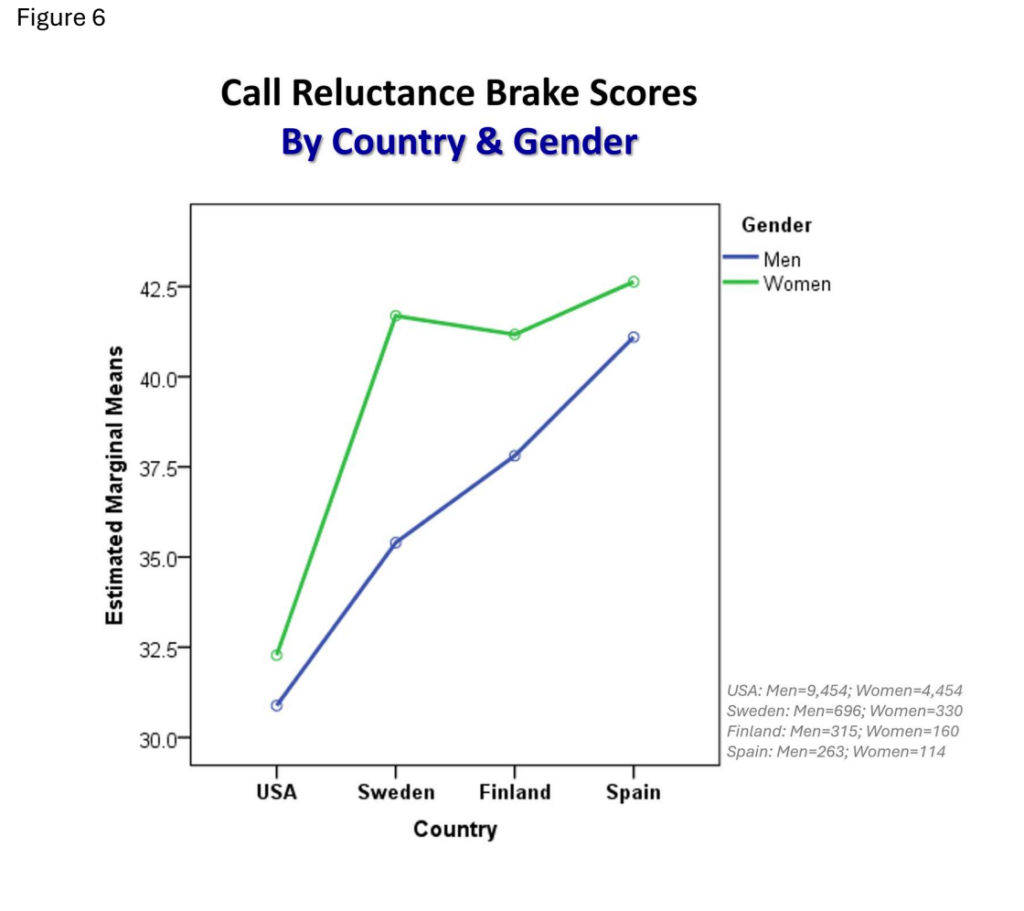
The initial analyses examined gender profile scores for call reluctance overall, as measured by the comprehensive Brake scale. The average Brake scores for gender by country are summarized in Table 1 and graphically plotted in Figure 6. The results show the average Brake profile scores for women tend to be slightly higher than the average scores for men across countries. Although the direction of score differences is consistent across countries, the results obtained are associated with small effect sizes (η2 <= .055), suggesting a lower degree of practical meaning and predictive value.
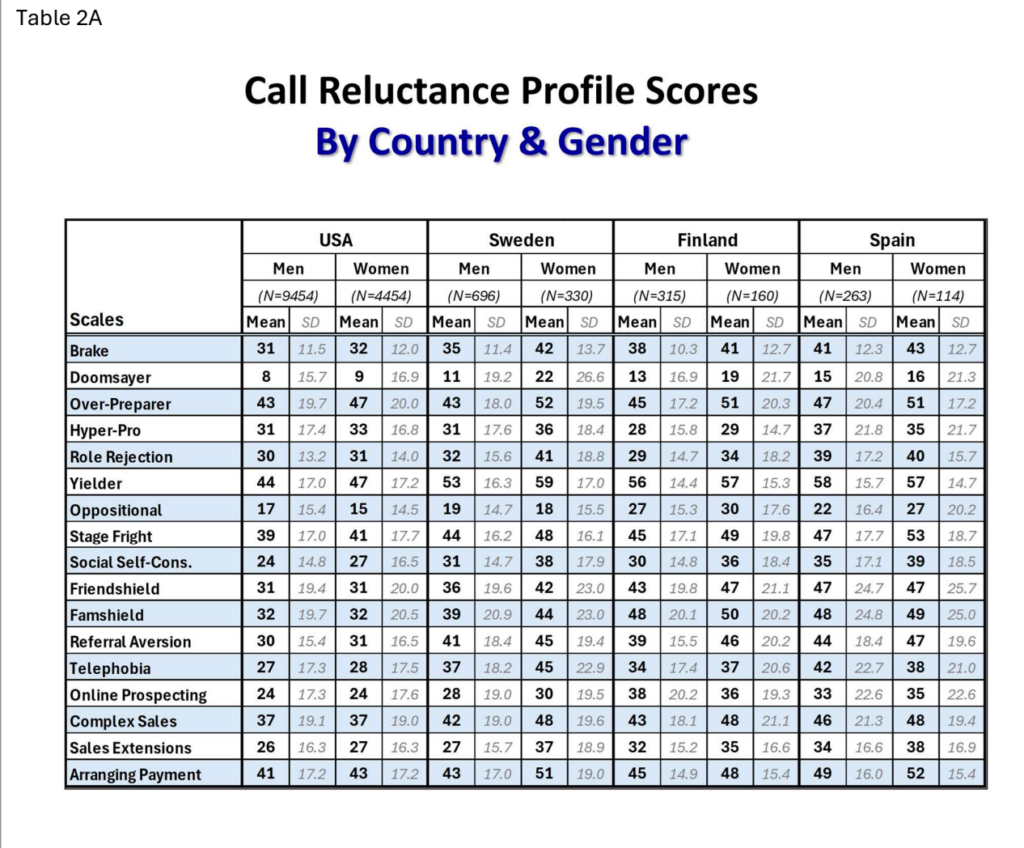
The gender profile comparisons for the Brake scale are informative because these results are generally reflective of the results for the call reluctance types. A summary of mean (or average) profile scores for men and women are shown by country in Table 2A.
The comparison of call reluctance scores by gender are associated with relatively small effect size results, which indicate minor practical differences between men and women. These differences are particularly small for the US (η2 <= .01), Finland (η2 <= .036), and Spain (η2 <= .021). Although the results obtained for Sweden include slightly higher profile score differences by gender, the effect sizes indices are generally small (η2 <= .055), with the exception of the Sales Extension scale. This single scale is associated with a moderate effect size index (η2 = .07), which suggests a more meaningful difference in score profiles (Cohen, 1988).
A tabulation of profile score differences by gender is summarized in Table 2B for each call reluctance scale. These tabulations are based on the subtraction of men’s scores from women’s scores. Thus, a positive score difference indicates a scale where women scored higher than men. Women in the US have an average 1-point score difference with men on the call reluctance scales overall. The overall average score difference is 3 points in Finland, 2 points in Spain, and 6 points in Sweden (these average score differences happen to match the differences in average Brake scores for women and men by country).
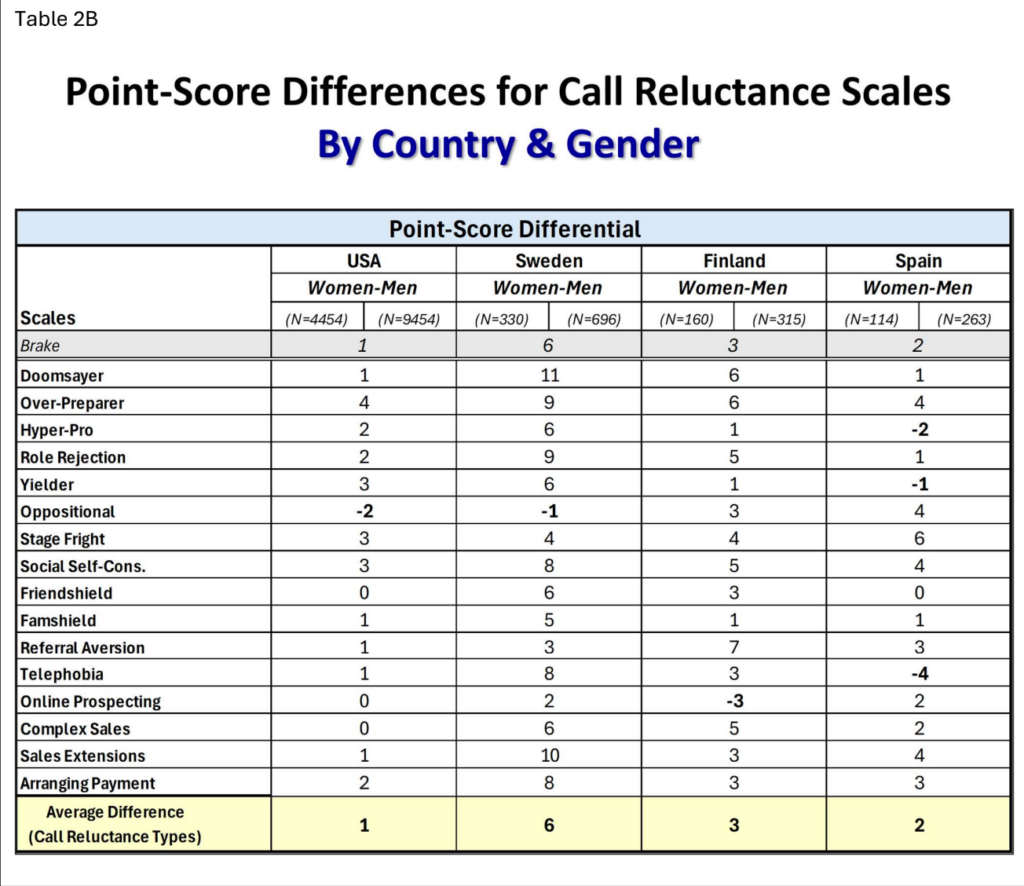
As further shown in Table 2B, women in Sweden have a double-digit average score difference with men on the Doomsayer scale (11 points) and the Sales Extensions scale (10 points). Although the score difference for the Sales Extensions scale is associated with a moderate effect size (η2 = .07) as previously mentioned, the Doomsayer scale is associated
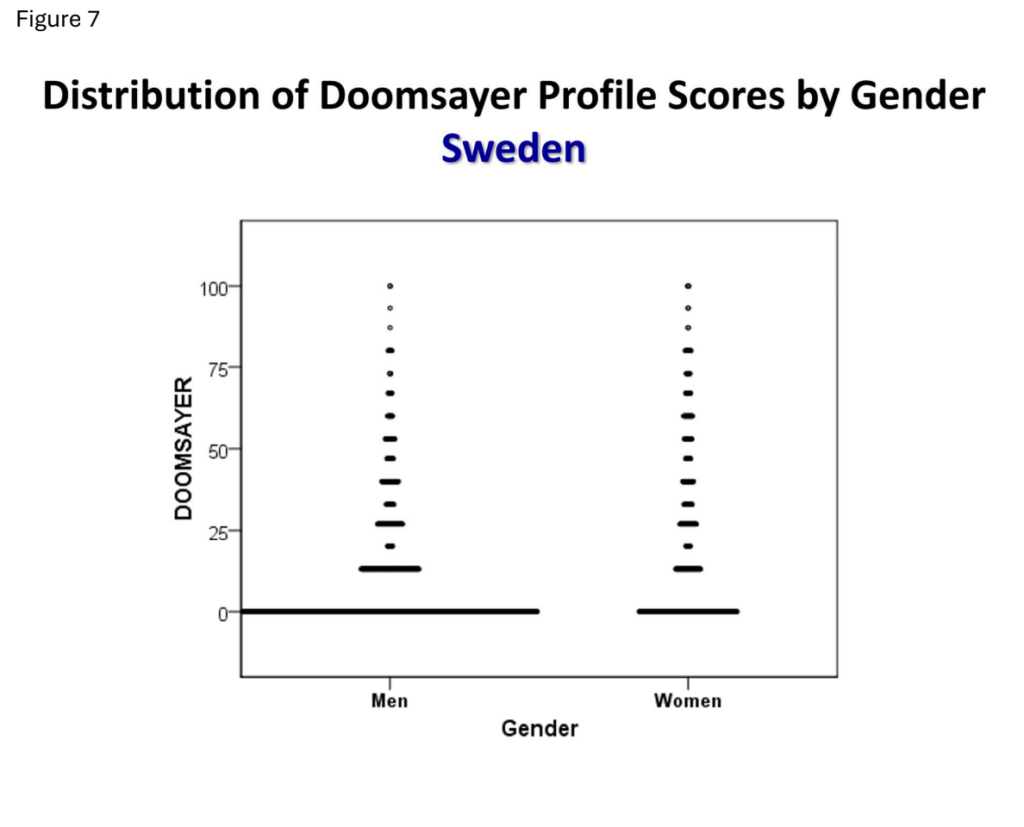
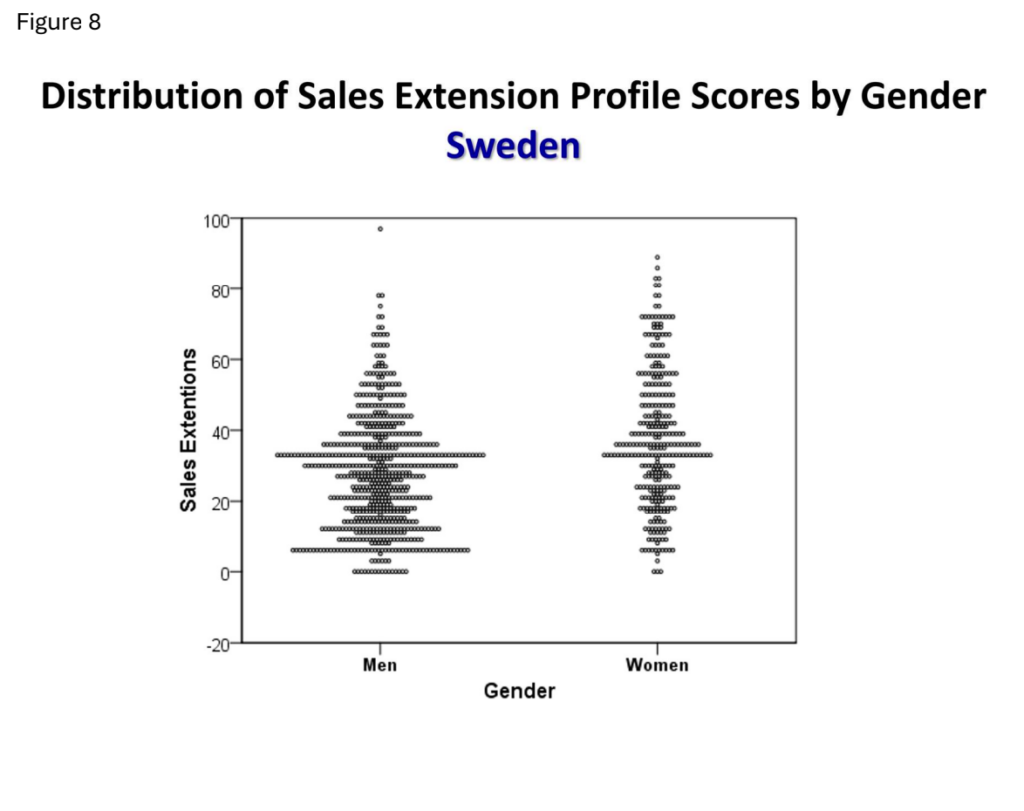
with a smaller effect size (η2 = .053). One factor associated with effect size computations is the level of variation in score distributions. A graphical display of the score distribution for Doomsayer is shown in Figure 7. The score distributions for men and women are proportionately similar, which may contribute to a smaller effect size index as compared to the differences in score distributions for the Sales Extension scale shown in Figure 8, where the score distributions from men and women are more dissimilar, and thus associated with a higher effect size index.
Gender Comparison Studies: Impostor Scales
A summary of Impostor profile scores for men and women is shown in Table 3A by countries. Higher scores on the Motivation and Goal Level scales are preferred and lower scores on the remaining Imposter scales are preferred. The results obtained indicate that women tend to score lower on Motivation and Goal Level than men, yet the differences are associated with small effects which suggest small practical distinctions in score profiles (η2 <= .042).
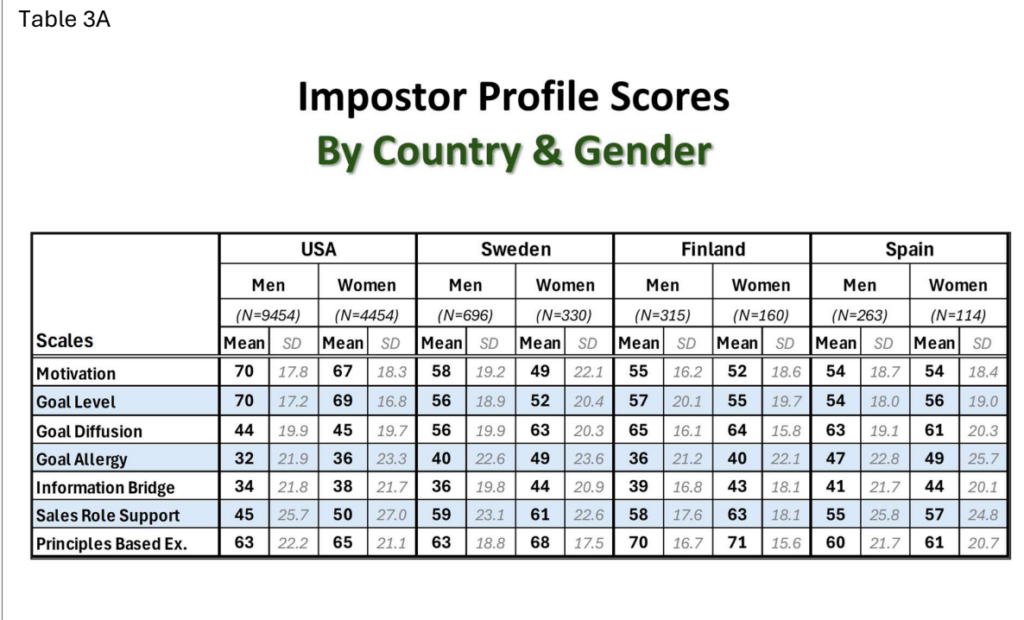
Results further show that women tend to score higher than men on the remaining Impostor scales, with the exception of the Goal Diffusion scale for women in Finland and Spain. As shown in Table 3B, on the Goal Diffusion scale, women in Finland average 1-point lower and women in Spain average 2 points lower than men. The differences in these Impostor scales are relatively minor (η2 <= .037).
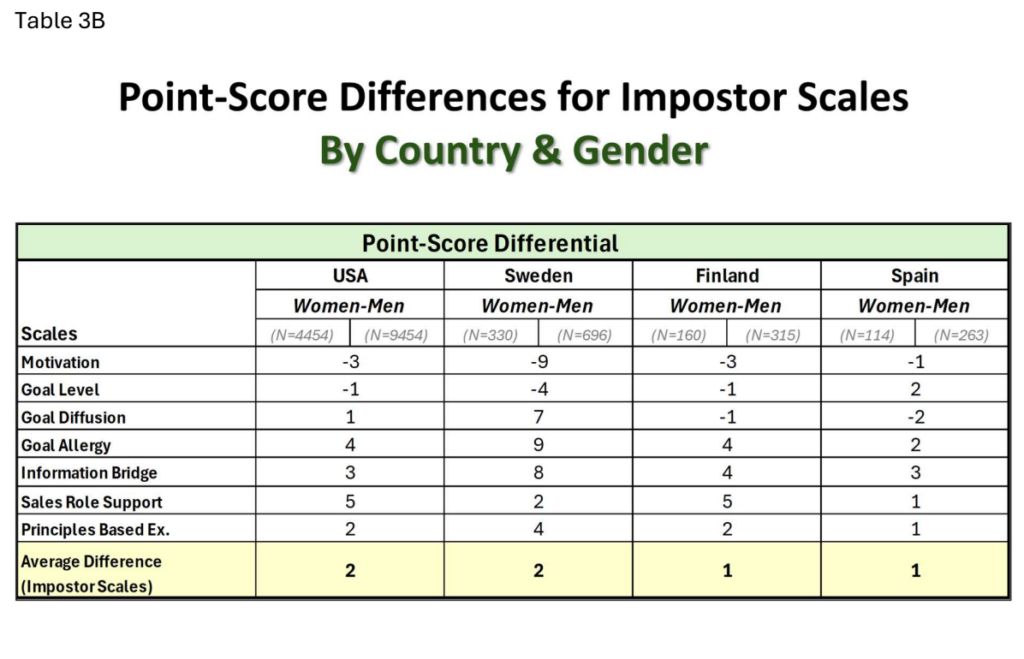
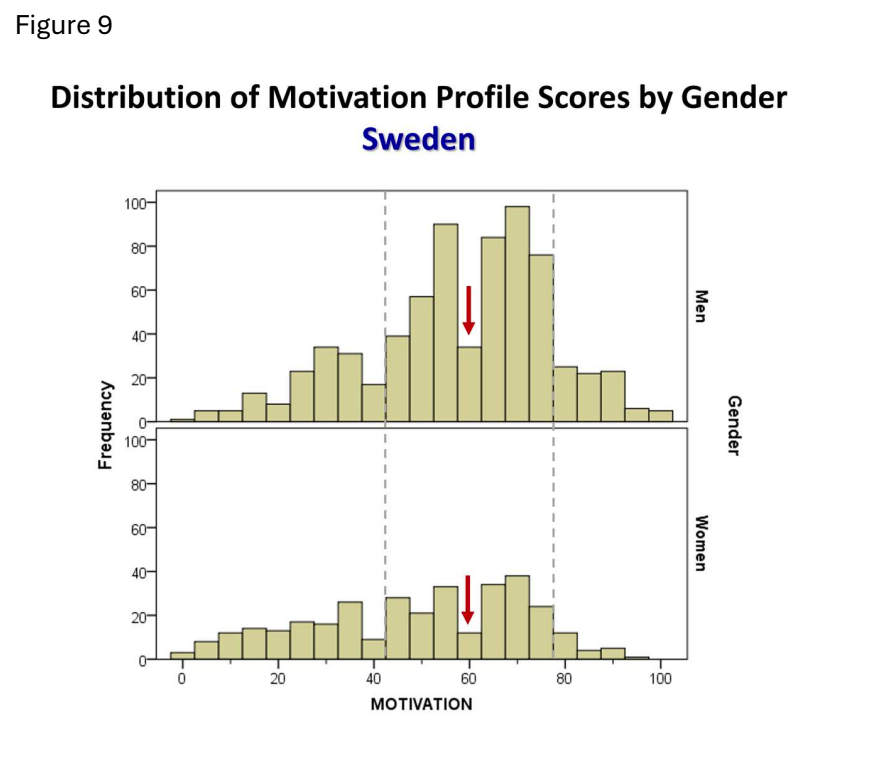
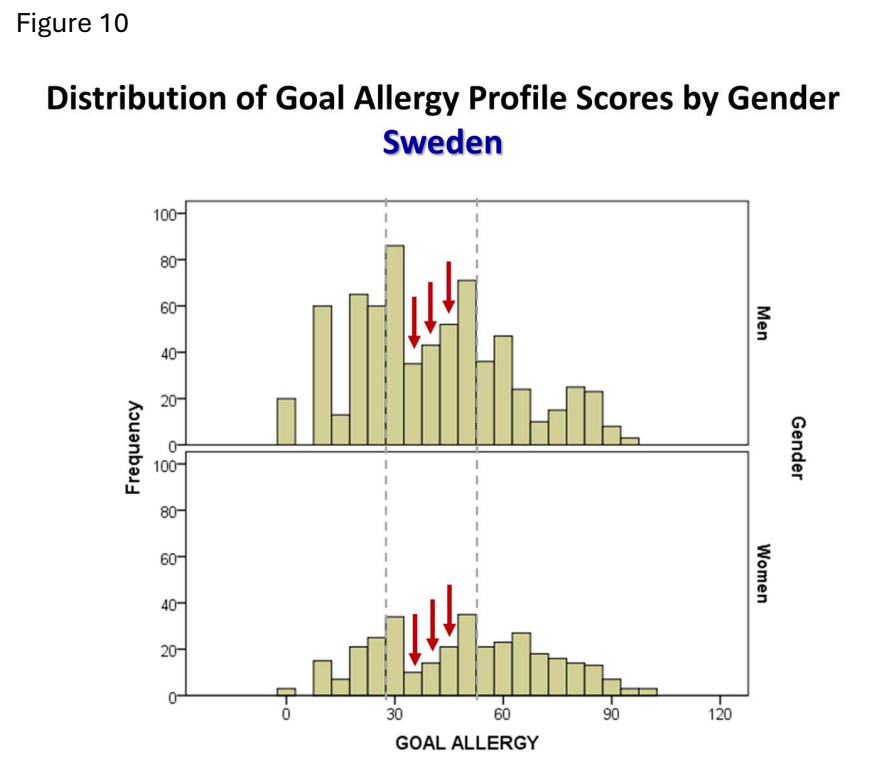
As also shown in Table 3B, women in Sweden have the largest difference in profile scores as compared to men on the Motivation scale (9 points) and the Goal Allergy scale (9 points). Score distributions for these scales are shown in Figures 9 and 10. The shape of these distributions contain some similarities between men and women. This similarity in variation can contribute to smaller effect size differences between men and women overall.
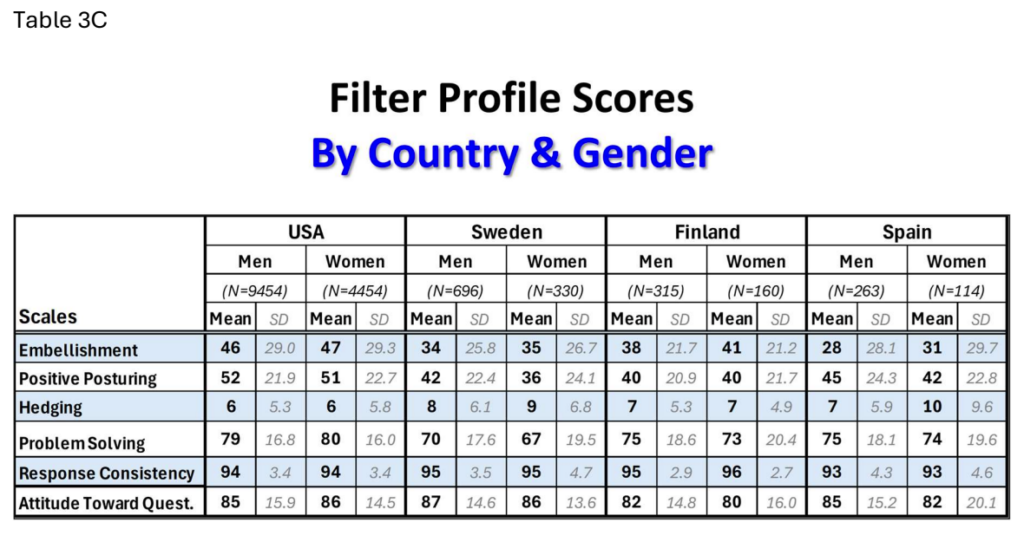
Gender Comparison Studies: Filter Scales
Table 3C summarizes profile scores for the Filter scales by gender and country. Differences in score profiles are minor (η2 <= .039).
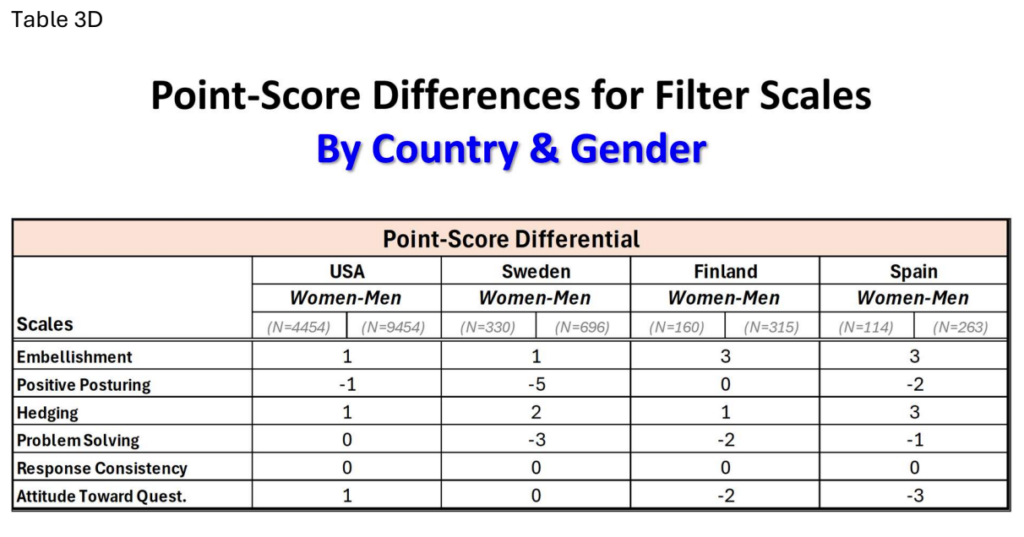
There are no trends or patterns associated with filter scales based on gender. On the Response Consistency scale, there are virtually no gender differences at all across countries, as shown in Table 3D.
Research on Motivation and Goal Level Introduction
Achieving success in sales can be dependent upon multiple factors associated with individual traits and organizational influences. Yet extensive research has identified a core competency that is fundamental sales success regardless of industry. This fundamental requirement is the need to interact with prospective customers and promote products and services that meet their needs. However, many salespeople feel uncomfortable taking the initiative to contact prospective customers due to feelings and behaviors associated with call reluctance. In addition to lower levels of call reluctance, high achievers also need supportive levels of sales motivation and goal focus. Research has shown that many salespeople are challenged by insufficient motivation and goal focus which can significantly influence their daily sales activities and level of career success. A series of studies were conducted to examine the motivation and goal level profiles of salespeople in an effort to gain more insight into these important factors. These studies were conducted among salespeople in Sweden, Finland, Spain and the US.
A comparison of profile scores for the Motivation and Goal Level scales is shown by country in Figure 11.
The results show an average profile score of 69 for salespeople in the US on the sales motivation and goal level scales. By comparison, profiles scores for the other countries averaged between 54 to 56, which represents a statistically significant difference (p. <001).
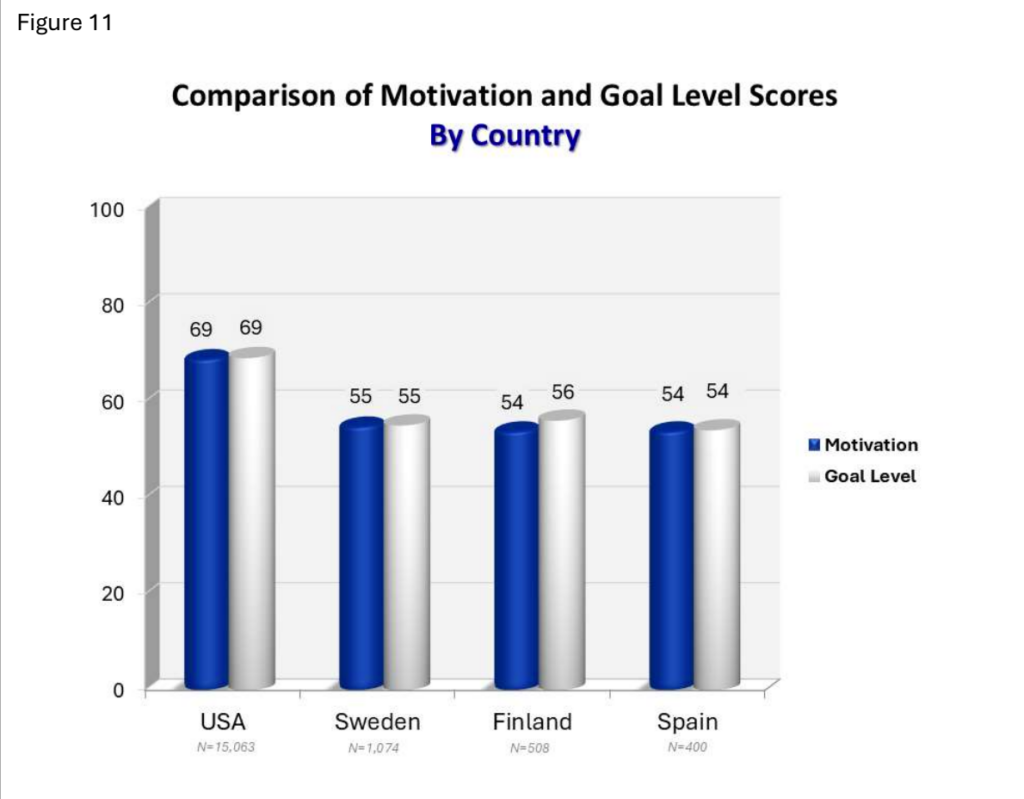
Results further show that the differences in level of motivation and goal level represent a moderate effect size (η2 = .062 and .065 respectively).
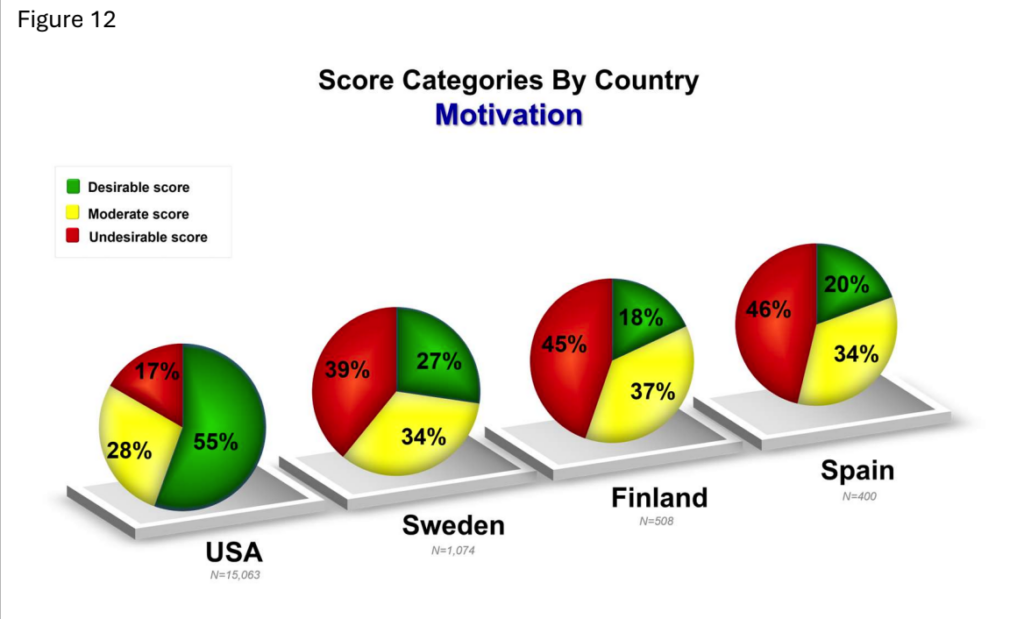
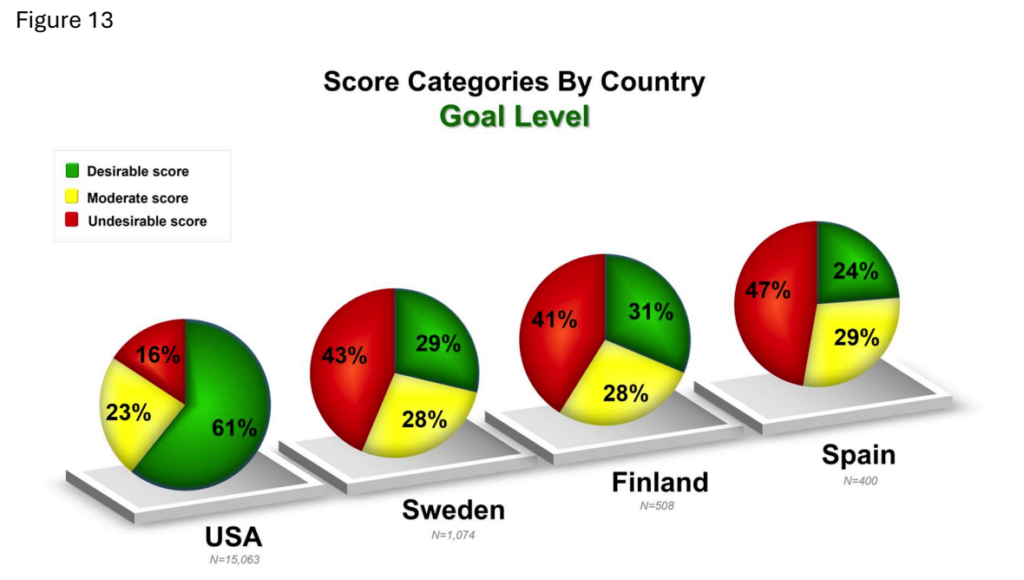
To further illustrate these differences, the profile scores for Motivation and Goal Level were categorized into corresponding high, moderate, and low score groupings. The results for the Motivation scale are graphically summarized in Figure 12, which shows that approximately 55% of US salespeople have high profile scores, in contrast with the fewer percentage of high motivation scores for Sweden (27%), Finland (18%), and Spain (20%).
The results for the Goal Level scale, shown in Figure 13, are similar. Approximately 61% of US salespeople have high profile scores, compared to a fewer percentage that ranges from 24% to 31% in other countries. Although higher motivation and goal level scores are desired, studies have repeatedly shown that individuals with moderate profile scores can also achieve top levels of sales production.
In an effort to increase sales production, it is common for sales executives to continually seek ways to further motivate their sales teams. Typical practices include offering bonuses, sponsoring sales contests and creating competitive compensation plans as a means to incentivize salespeople to generate more revenue and earn higher sales commissions.
The focus on increasing sales income may be a contributing factor that helps explain the higher levels of motivation and goal level among US salespeople, since many of them rely on earned commissions to source or supplement their income.
An analysis was conducted to examine the percentage of salespeople who rely upon sales commissions. The results, summarized in Figure 14, show that type of compensation varies between countries. In the US, approximately 54% of salespeople are compensated by salary plus commission. And only 17% of salespeople in the US are compensated by salary alone. In contrast, approximately 56% of salespeople in Sweden are compensated by salary, which compares to the 44% in Finland and 42% in Spain who are compensated by salary.
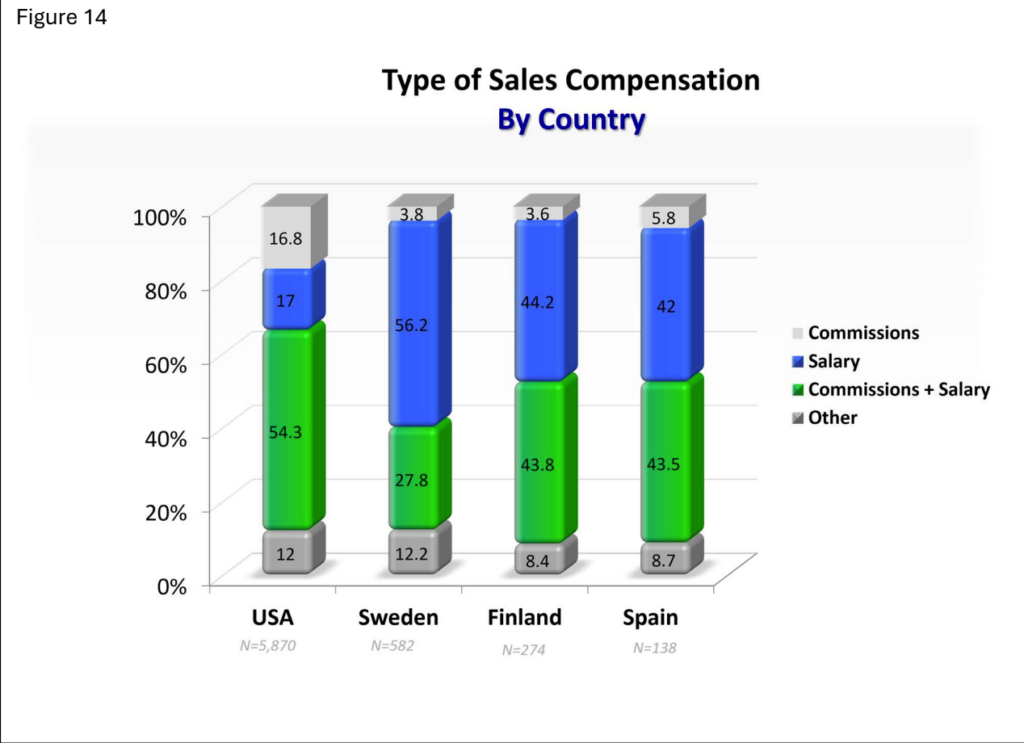
Further results show that approximately 17% of US salespeople are dependent upon earned commissions alone, as compared to approximately 3% to 6% for their sales counterparts in other countries. The differences in compensation structure among countries is statistically significantly, (X2 (9, N=6,864) = 638.9, p<.001). This result is influenced by the large sample sizes. However, this difference is also associated with a moderately substantial effect size (Cramer’s φc=.18), (Cohen, 1988), indicating a practically meaningful difference in type of compensation by country.
Examining Motivation and Goal Level for Further Insight
Although there are differences in types of compensation among salespeople, their concerns about being in the profession of sales are relatively similar. Study results even indicate that most salespeople express no concerns about their sales career, as shown in Table 4, which might indicate that they feel competent serving in a sales role. These percentages range from 48.3% for Spain to 55.8% for the US.
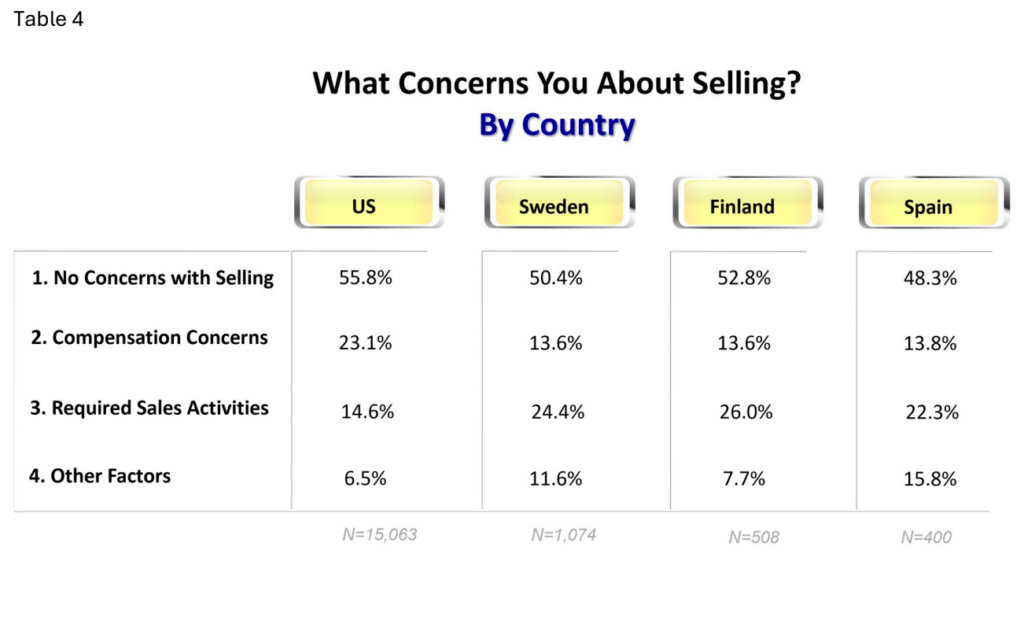
The second most common response in the US, is a concern about compensation factors (23.1%). Approximately 14% of salespeople in other countries share this same concern. Further results indicate that 22% to 26% of salespeople in Sweden, Finland and Spain feel some level of discomfort with selling. Nearly 15% of salespeople in the US have similar concerns. Overall, the results for sales-related concerns are statistically different among countries, as expected due to the large sample sizes (X2 (9, N=17,045) = 270.6, p<.001). However, further analyses indicate these differences have a relatively small effect size (Cramer’s φc=.07), which suggests small practical differences between countries in terms of applied considerations.
Further research was conducted to examine if profile scores for Motivation and Goal Level differed among countries based on concerns salespeople have about selling. A between group analysis was conducted with a priori planned comparisons based on the theory that salespeople who have no concerns about selling will have higher levels of motivation and goal focus. Likewise, it was hypothesized that those who have concerns about their income, regardless of type of sales compensation, will also be more motivated and goal focused in their approach to selling. Data for these two groups was analyzed in comparison to the groups who are concerned about required sales activities or other factors. These planned comparisons were conducted for each country, with effect size analyses (partial η2).
According to the results, those who have no concerns about selling or those who feel the need for increased compensation, have significantly higher levels of motivation and goal focus as compared to salespeople who are concerned about engaging in required sales
activities or have other concerns. The distinction in level of motivation and goal level is associated with moderately strong effect sizes for the US (ηp2=.091, .098), Sweden (ηp2=.124, .106), and Finland (ηp2=.078, .097). The difference in scores on motivation is associated with a small effect size for Spain (ηp2=.037), and a moderate effect for goal level (ηp2=.065). A summary of the mean profile scores and standard deviations is shown in Table 5. A graphical summarization is provided in Figures 15 and 16, for the Motivation and Goal Level scales, respectively.
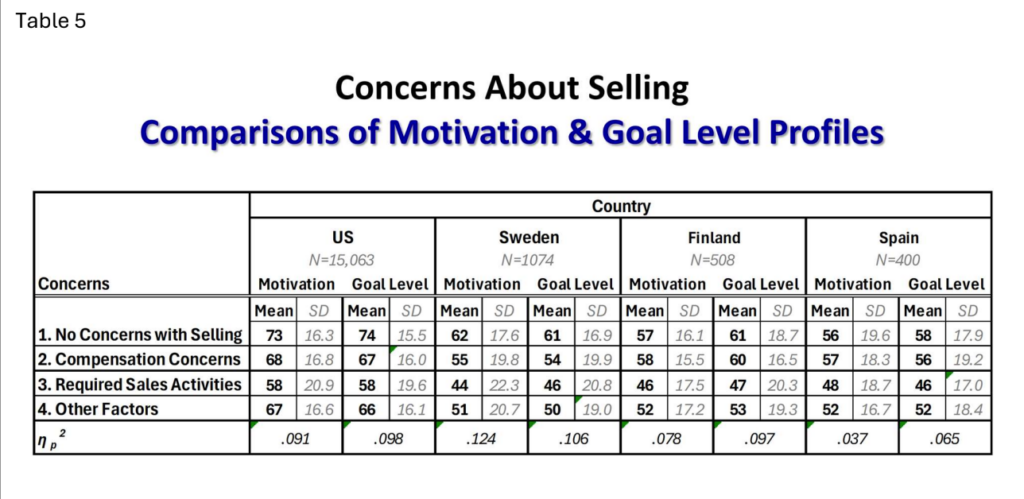
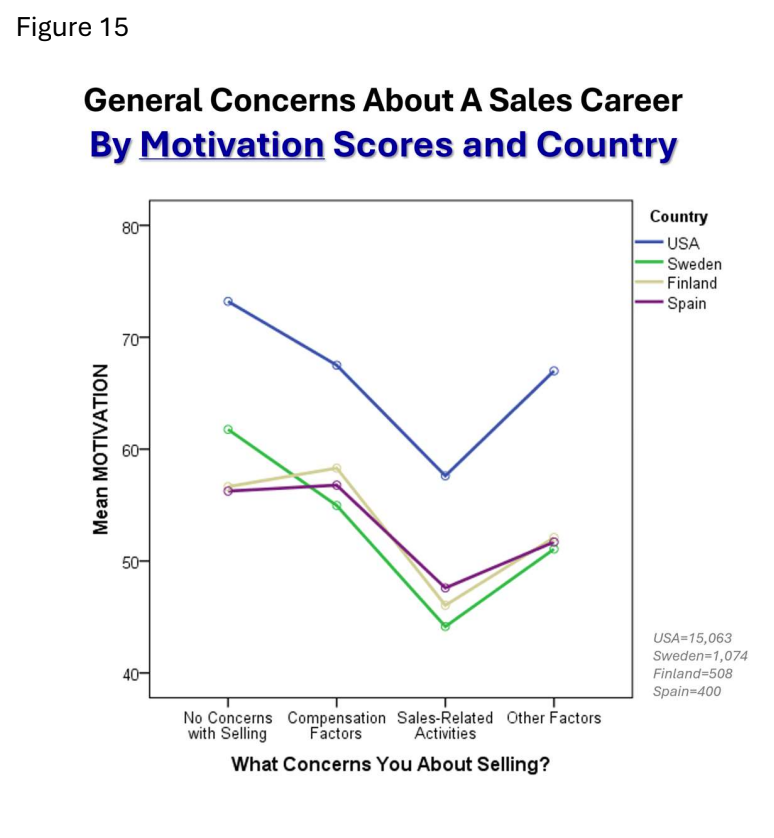
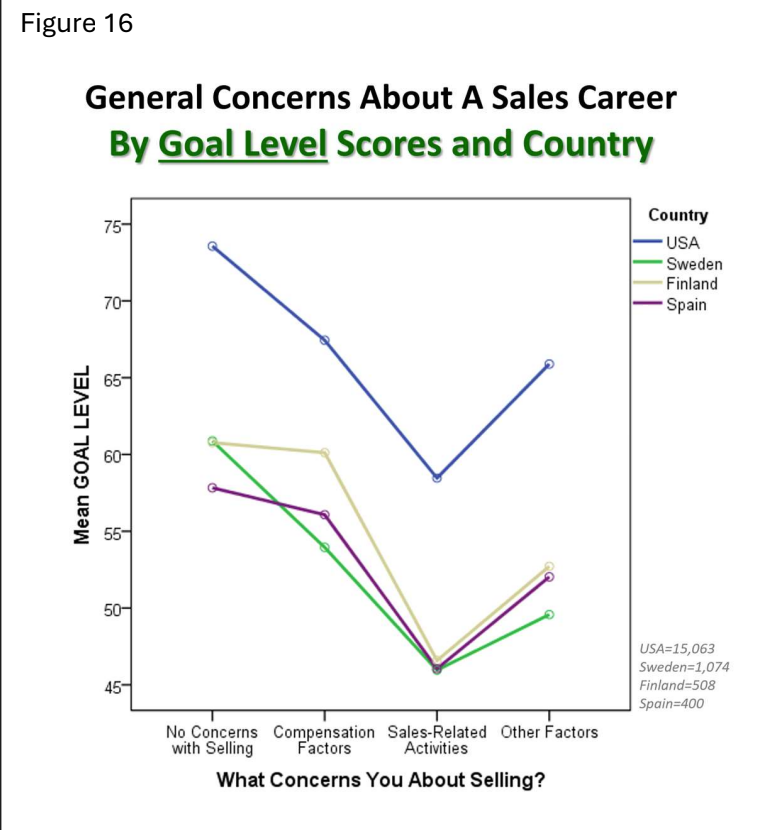
The overall distinction in score profiles for the group comparisons supports the hypothesis that those who are comfortable selling or those who desire increased income are likely to be more motivated and goal driven. This result is particularly applicable to salespeople in Sweden, where the effect size differences are the highest in comparison to other countries.
Comparison of Sales Activities
The need for motivation and goal focus is not only essential for engaging in sales activities, but also for engaging in sales training—which like selling, also requires energy and focus. Salespeople who are well-trained are likely to have more of the knowledge, skills and abilities required to generate new sales and manage a customer base. Both of these activities are important to success in sales, although building a new customer base can be more challenging than supporting an established base of customers you already know.
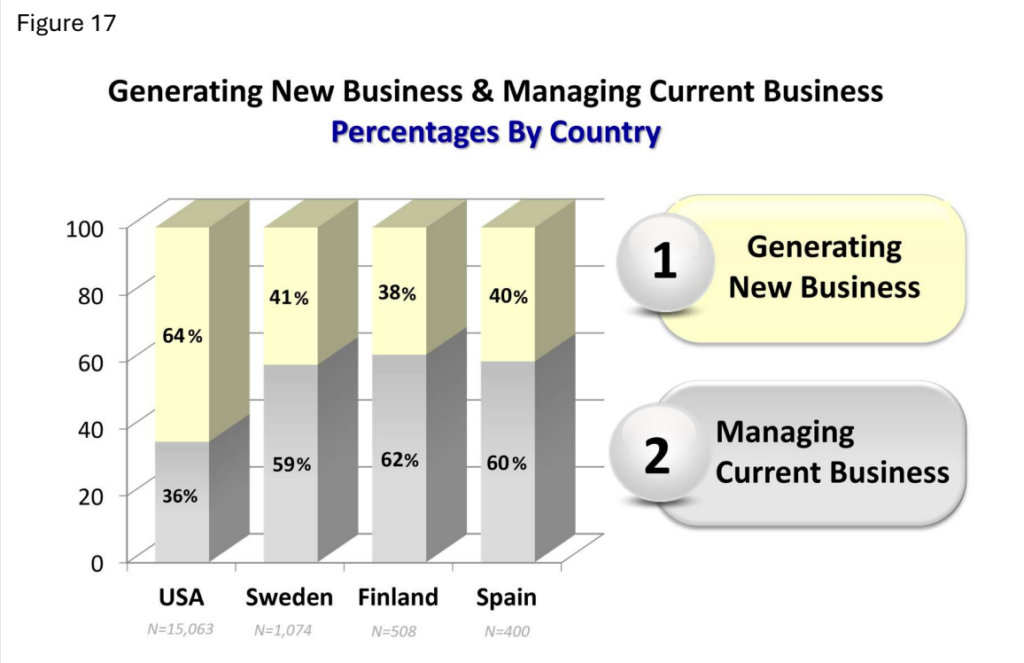
A research study was conducted to examine if salespeople felt more knowledgeable and skilled at building a new customer base or supporting an established customer base. Further analyses were conducted to examine if there are differences in Brake, Motivation and Goal Level scores based on these two competencies.
The data in Figure 17, summarizes which sales activity salespeople indicate they are most competent at doing. Approximately, 64% of US salespeople indicated a greater competency at generating new business. There are approximately 41% in Sweden, 38% in Finland and 40% in Spain who also feel more competent in their ability to generate new business.
Results further indicate that salespeople across countries who are more competent at generating new business also have lower Brake profile scores and higher levels of motivation and goal focus, as shown in Figure 18.
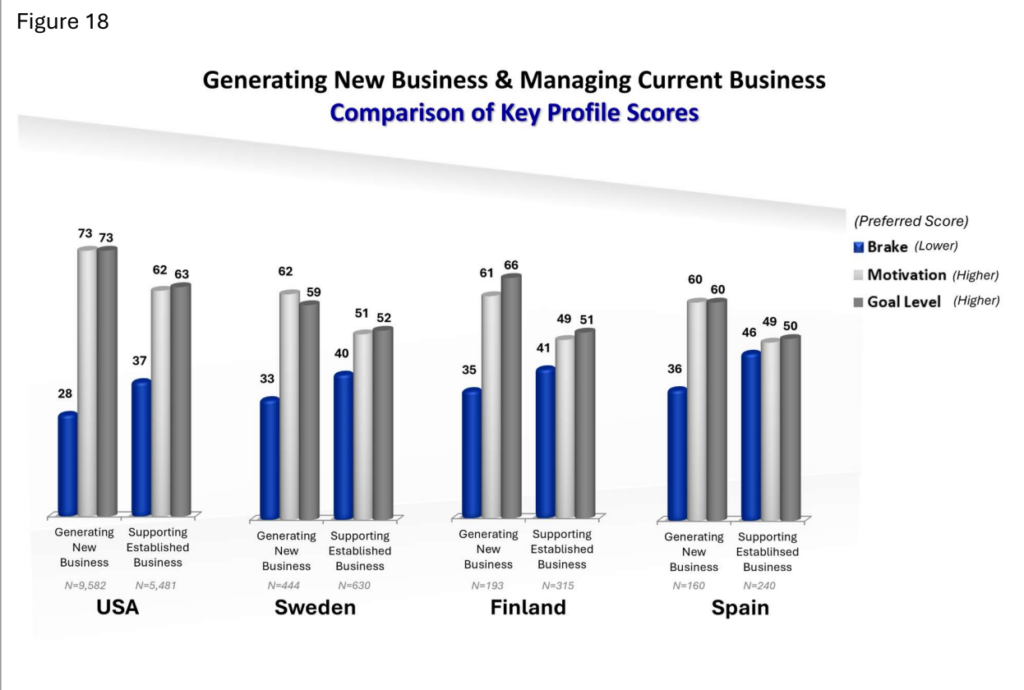
The differences in Brake, Motivation and Goal Level scores were primarily associated with moderate to large effect sizes for every country (η2=.064 to .158). There is a small effect size difference in Goal Level scores for Sweden (η2=.036). Overall, these results suggest there is a fundamental core difference between salespeople who are more adept at generating new business as compared to those who feel more competent supporting an established customer base. And these differences are defined by higher levels of motivation and goal focus, in addition to lower levels of overall call reluctance.
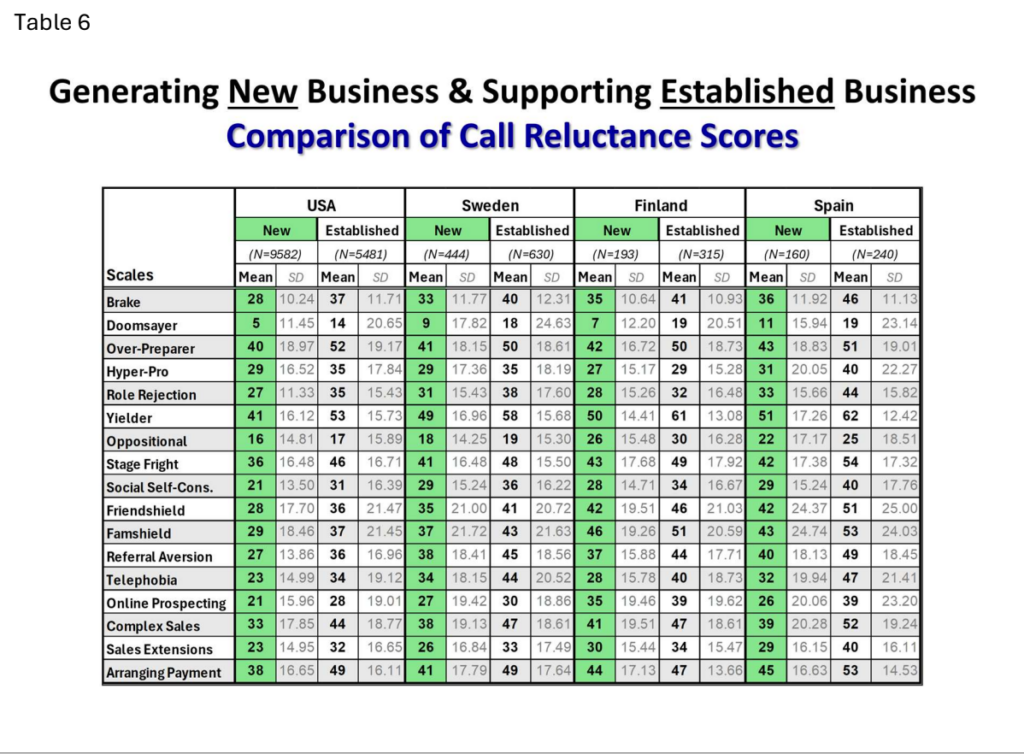
Based on these results, further research was conducted to examine if there are meaningful differences in call reluctance types and Impostor scales between salespeople with differing competencies. The results for the call reluctance scales are shown in Table 6. These results indicate a pattern of lower profile scores for each form of call reluctance across countries. These results were associated with small to moderate effect sizes (η2=.001 to .127).
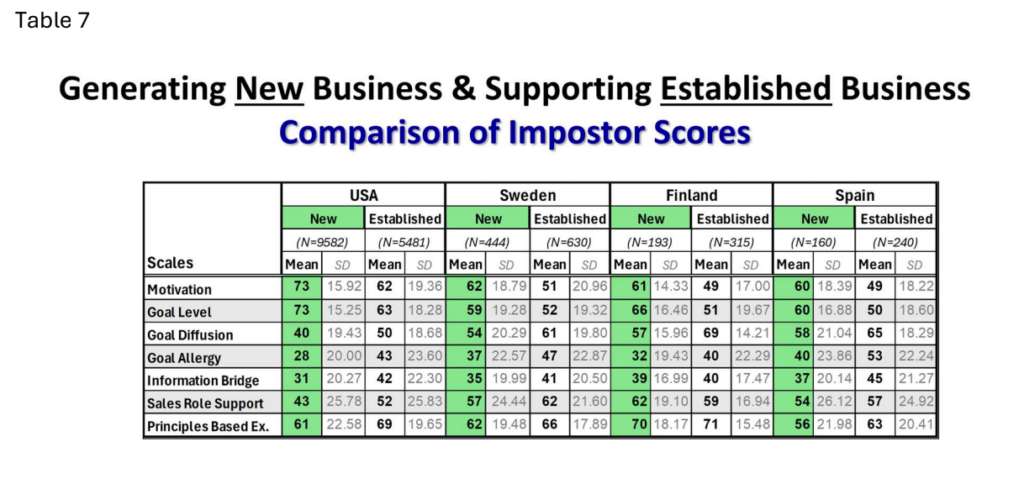
Results for the Impostor scales are summarized in Table 7. Lower scores on the Impostor scales are preferred (with the exception of Motivation and Goal Level scales). The results indicate lower profile scores for each of the Impostor scales, where a lower score is more optimum. These results are consistent across countries and associated with small to moderate effect sizes (η2= .001 to.133).
Overall, the results obtained in this study represent a definitive core difference between salespeople who are more capable of generating new business versus those who feel more capable supporting their established business. And this distinction is based on differences in call reluctance scales and Impostor scales, which mimic call reluctance in reference to their association with lower sales productivity.
Additional Research
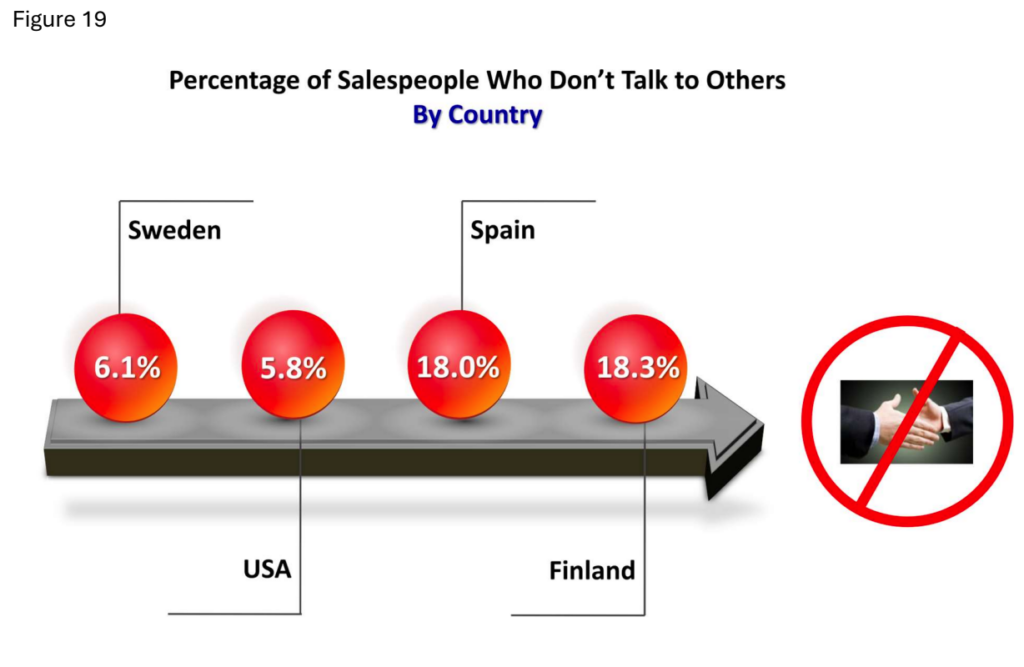
A final study was conducted to examine if salespeople are comfortable speaking to individuals they do not know. Although such activity is standard for those in a sales role, previous research has shown there are salespeople who avoid opportunities to engage with others. The results obtained in this study indicate that approximately 6% of salespeople in Sweden and the US tend to avoid opportunities to meet new people (Figure 19). A larger percentage of approximately 18% of salespeople in Spain and Finland avoid communicating with new people.
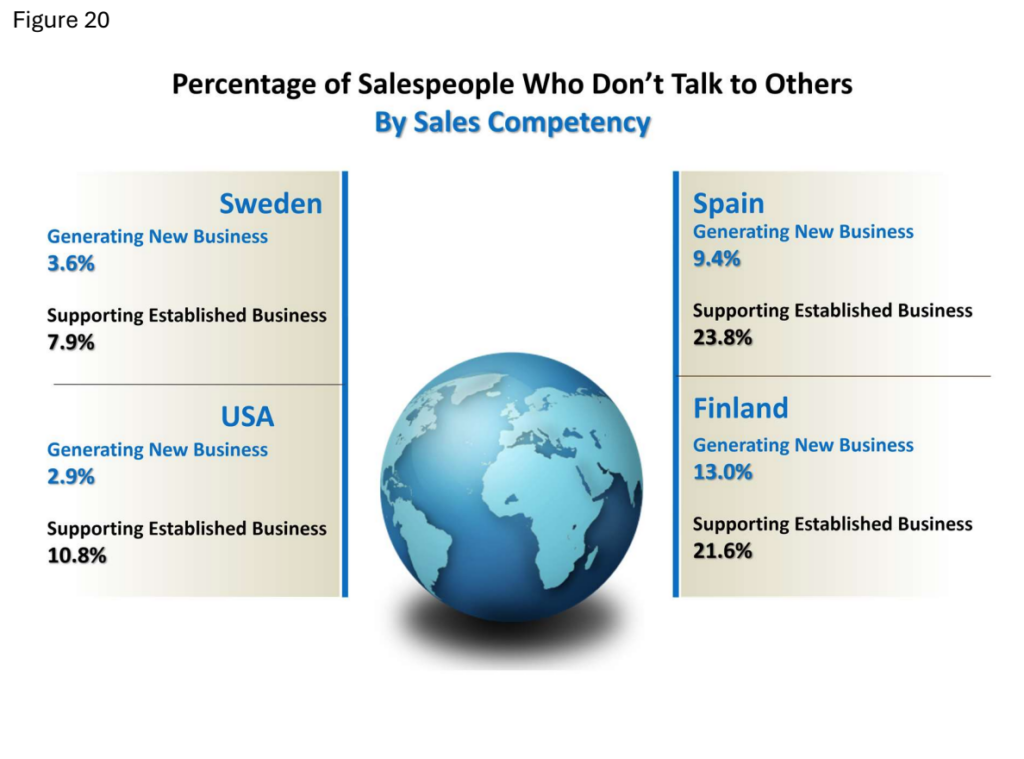
An additional analysis was performed to examine if the tendency to avoid talking to new people differs by sales competency. In this study, sales competencies were categorized as: 1) Generating new business or, 2) Supporting an established customer base. The results obtained are listed in Figure 20. As shown, salespeople who are more competent at generating new business, are less likely to avoid opportunities to meet prospective customers. On the other hand, individuals who are most competent at supporting an established customer base, also have a higher tendency to avoid speaking to new people. The differences in these percentages are associated with small effect sizes, which are likely due to similarities in the larger percentages of salespeople who do indeed speak to new people as a standard practice.
Some Concluding Thoughts
The overall results obtained in these series of studies suggest that individuals who are skilled at selling and those who have a need to achieve, tend to have higher levels of motivation or energy to engage in sales activities, regardless of their culture or work environment. Also, research has shown that salespeople do not need a very high level of motivation or goal focus to succeed in their careers. But they do need to optimize the motivational energy they do have, otherwise this energy can get diverted into fear-based coping behaviors associated with call reluctance and/or other behaviors that simply serve as “goal distractors.”
Here are a series of questions that may be useful to consider:
- “What would I do differently if I had more energy and focus?”
- What could I achieve if I spent more time engaged in this activity? (Fill in the blank with a sales-related activity.)
- What is one barrier that is holding me back that I personally have control over?
- Is that personal barrier really worth the energy drain or the opportunity that it costs me?
a.) If the answer is “yes”, then I am at a certain peace that I can live with.
b.) If the answer is “no”, then I can at least make an effort to challenge this personal barrier. After all, I’m the one with personal control. I am able.
Trelitha R. Bryant
“The secret of getting ahead is getting started.” – Mark Twain
References
Cohen, J. (1988). Statistical Power Analysis for the Behavioral Sciences (2nd ed.). Hillsdale, NJ: Lawrence Erlbaum Associates, Publishers.
Dudley, G. W., Bryant, T. R., Goodson, S. L., & Dudley, S. C. (2014). Sales Preference Questionnaire*Gold/Full Spectrum Advocacy [Measurement instrument]. Dallas, TX: Behavioral Sciences Research Press.
Dudley, G. W., & Goodson, S. L. (1982). Sales Preference Questionnaire [Measurement instrument]. Dallas, TX: Behavioral Sciences Research Press.
Dudley, G.W., & Goodson, S.L. (2007). The psychology of sales call reluctance: Earning what you’re worth in sales (5th ed.). Dallas, TX: Behavioral Sciences Research Press, Inc.
Dudley S. C., & Bryant, T. R. (2020). Relentless: The science of barrier-busting sales. Dallas, TX: Behavioral Sciences Research Press, Inc.
Stevens, J. (1992). Applied multivariate statistics for the social sciences. Hillsdale, New Jersey: Lawrence Erlbaum Associates
© 2024, Behavioral Sciences Research Press, Dallas, Texas USA. ALL RIGHTS RESERVED. 36
